In many organizations, local weather data already exists, and analytical tools make it possible to track trends or trigger regional alerts.
However, when it comes to making decisions in the field, coordinating a rescue team, initiating a response, or starting agricultural treatments, this information often remains isolated and disconnected from the reality on the ground.
It is this disconnect between data and action that still limits their use today, both in crisis management and in the agricultural sector.
The discrepancy between regional weather forecasts and local conditions
In a region like Occitanie, weather phenomena are becoming increasingly unpredictable and localized. Cévenol episodes, late frosts, or intense thunderstorms affect certain plots of land or municipalities while sparing those right next to them.
Municipalities face flooded roads or landslides in specific areas, while the rest of the territory remains passable.
In this context, average regional weather forecasts lose their practical value. What matters is what is happening here and now—at the scale of a plot of land, a road, or a sensitive site.
The difference can sometimes come down to just a few hundred meters.
The weather crises of 2025–2026, in fact, highlighted the limitations of general models.
- For the farmer: A hailstorm on April 18 in the Cévennes affected one out of every two plots, leaving the other unscathed.
- For the mayor: A violent thunderstorm in Haute-Garonne blocked specific roads due to landslides, while the rest of the municipality was spared.
- For the insurer: In the absence of precise data, these situations remain difficult to assess, even in the context of insurance claims evaluations.
For those on the ground—whether they are leaders of agricultural equipment cooperatives (CUMA), crop managers, or crisis managers—the need is clear: to know where to intervene, when to act, and how to coordinate efforts in the face of hazards that do not respect administrative boundaries.
In the face of this increasing variability, a clear need is emerging: access to weather data grounded in local conditions that can be directly applied in the field.
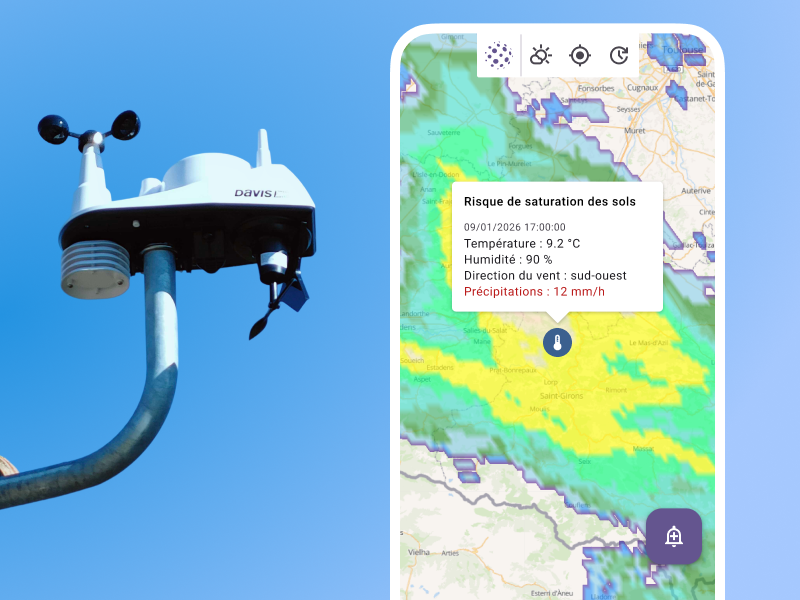
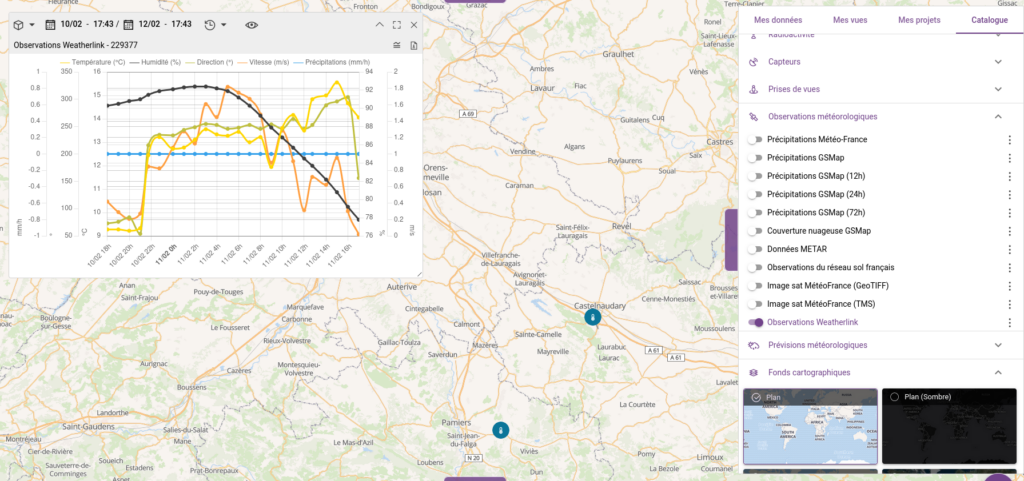
To meet this need, Kalisio has integrated data from connected weather stations, such as those from WeatherLink, directly in its mapping solution Kalisio Maps.
The goal is not to add another data source, but to transform how data is used: to make weather data a tool for ensuring the safety of regions and agricultural activities.
Displayed directly on the map, the data becomes immediately understandable. It is geolocated, contextualized, and linked to on-the-ground issues, whether they involve infrastructure, farmland, or high-risk areas.
Crisis Management: The example of Bormes-les-Mimosas
The town of Bormes-les-Mimosas was the driving force behind our initiative.
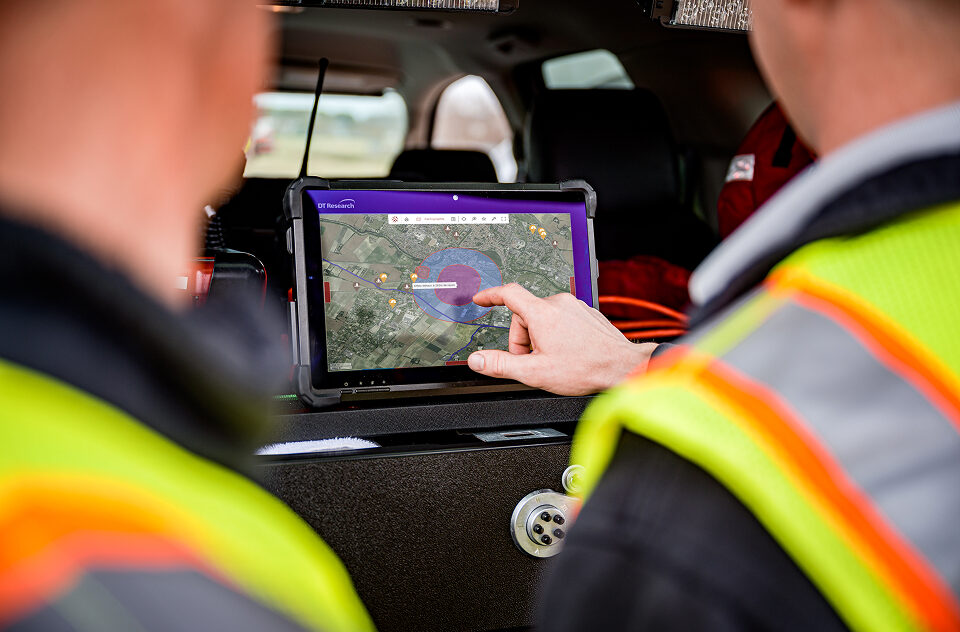
As part of its Municipal Emergency Response Plan (PCS), the town deployed Kalisio Crisis to equip its Municipal Command Center (PCC), a facility dedicated to coordinating responses during crises.
As Samuel Legigan, head of the Municipal Civil Protection Department, explains:
“This solution meets the needs of a community like ours: operational mapping, a logbook, but above all, the ability to track actions on the ground.”
The integration of local weather data aims to expand operational capabilities. Ultimately, teams will be able to visualize the localized impact of severe weather, anticipate risks (flooding, runoff, falling debris), and share reliable information with institutional partners such as the SDIS or the Gendarmerie.
Precision Agriculture: An Economic and environmental lever
Beyond crisis management, agriculture is the sector where this integration of data and maps is a game-changer for both the economy and the environment.
Agriculture accounts for about 10 to 12 percent of freshwater withdrawals in France, mainly for irrigation, according to the Data and statistics department.
By cross-referencing local rainfall data with evapotranspiration data, farmers can precisely adjust their water applications. Irrigation becomes more efficient, more water-efficient, and better tailored to the actual needs of crops.
Pest control treatments follow the same logic. Their effectiveness depends directly on weather conditions. Stakeholders such as Syngenta point out that wind speeds exceeding 15–19 km/h or insufficient humidity can cause the products to drift, reducing their effectiveness and increasing their environmental impact.
A careful assessment of local conditions allows for application only when the right conditions are met, thereby limiting the amount used and ensuring safe practices.
A shared and actionable vision for the region
One of the major benefits of map integration lies in the ability to share and cross-reference data across a region.
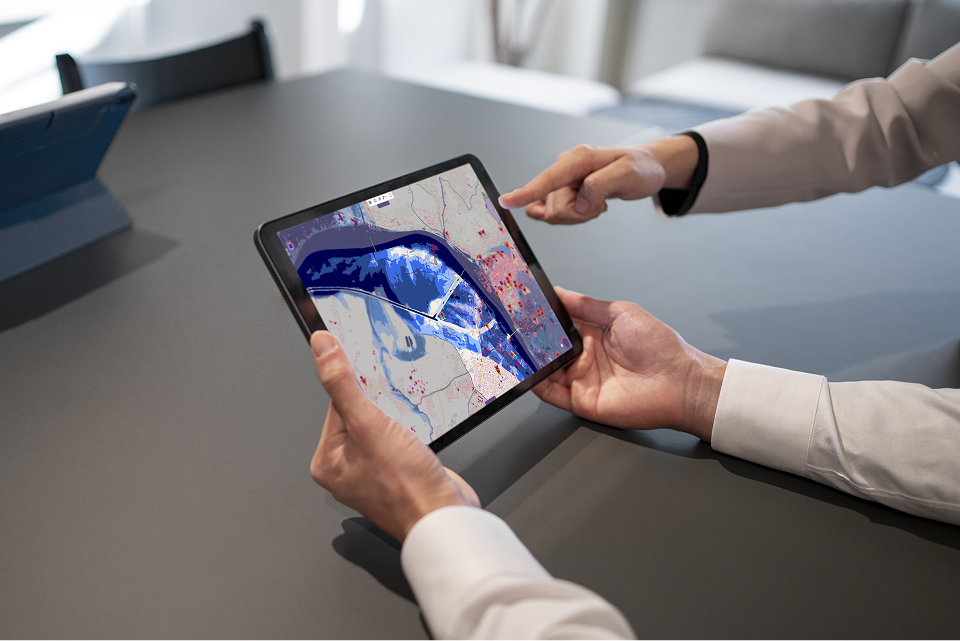
A CUMA (Cooperative for the Use of Agricultural Equipment) or other cooperative can thus monitor multiple stations spread across different farms, view a Cévenol weather event in real time, and quickly coordinate its response—whether that involves mobilizing equipment or organizing mutual aid among farmers. Similarly, a local government can cross-reference weather data with its high-risk areas—such as Flood Risk Prevention Plans (PPRI)—its infrastructure, or its road network, in order to more accurately anticipate the impacts of an event.
This networking enables a shift from a fragmented view to a coherent and shared understanding of the region.
It also paves the way for more advanced applications.
In agriculture, for example, combining weather data with crop location data makes it possible to identify conditions conducive to the development of diseases such as downy mildew or powdery mildew, or to anticipate frost events based on historical humidity, temperature, and precipitation data.
The historical context of data is a key asset for claims management. In the event of a weather-related incident, it becomes possible to demonstrate precisely that an event did indeed occur at a specific location and at a specific time, thereby facilitating assessments and the claims settlement process.
Finally, integration into a mapping tool allows for the seamless cross-referencing of weather data with existing business data. On a single interface, it becomes possible to visualize wind conditions over construction sites, rainfall over flood-prone areas, or even the history of treatments on registered agricultural parcels (CAP).
Accessible on both mobile and desktop devices, shared among various stakeholders, and connected to decision-support tools (OAD) via API, this approach centralizes information and streamlines communication. It prevents the proliferation of tools and facilitates rapid coordination among farmers, local authorities, and emergency services.
Toward more resilient regions
Whether it’s to ensure the safety of a crisis response or to manage a farm, the challenge is no longer just about accessing data, but about being able to use it immediately in context.
By integrating hyper-local weather data into Kalisio Maps, organizations gain a tool that directly links observation and action, enabling them to anticipate, coordinate, and adapt their decisions in response to increasingly localized events.
Would you like to integrate your weather data into your operational mapping?